Real User Monitoring Is Where Performance Arguments End

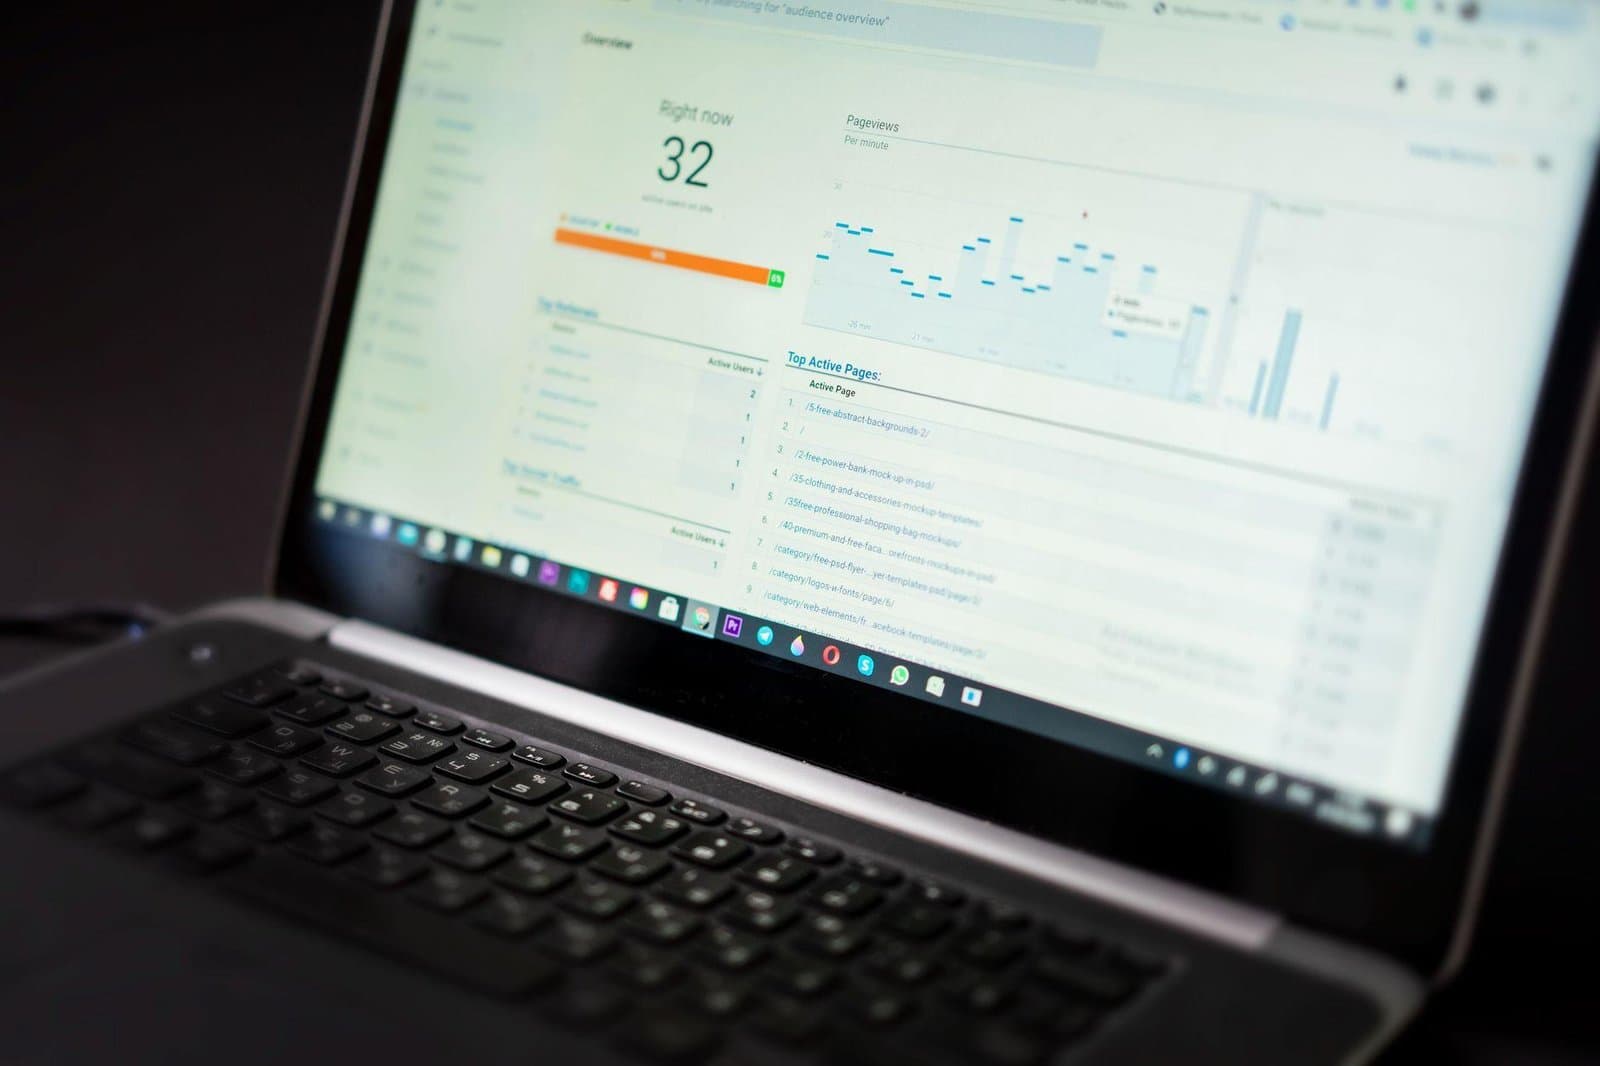
Performance debates often get stuck on lab scores. One tool says the page is fast. Another says it is slow. A developer tests on fiber. A customer complains from a mid-range phone. Everyone is technically looking at the site, but not the same experience.
Real user monitoring gives the argument a better place to land.
Field data changes priorities
RUM shows how real visitors experience pages across devices, networks, browsers, and traffic sources. That matters because the page that feels fine in the office may struggle for the customers who actually convert.
The goal is not to collect endless telemetry. It is to know which pages and moments need attention first.
Where to start
- Track LCP, INP, and CLS by template type.
- Separate mobile from desktop performance.
- Watch conversion pages more closely than low-value pages.
- Connect regressions to deployments and plugin changes.
- Use lab tools to debug issues found in the field.
Collect field data with a purpose
Start with a small set of page templates and business journeys: homepage, article, service page, product, checkout, login, or lead form. Capture Core Web Vitals and useful context such as device class, browser, connection type, route, release version, and geography where appropriate. Avoid collecting full URLs or identifiers that may contain personal data.
Sampling is often sufficient. The goal is a representative distribution, not a record of every visitor. Define retention, consent, access, and redaction with the same care applied to other analytics. Performance telemetry should not become an excuse to gather sensitive content.
Read distributions instead of averages
An average can hide the customers having the worst experience. Review the median and slower percentiles, then segment only when the segment can lead to a decision. A poor mobile result on a high-value landing page deserves more attention than a tiny regression on an archive few people visit.
Compare page templates and journeys over time. Mark deployments, theme changes, tag additions, experiments, and plugin updates so regressions have context. Field data tells you where and for whom a problem exists; it rarely tells you the exact line of code.
Use lab tools to explain field problems
Once RUM identifies a slow template or interaction, reproduce it with throttling, traces, request waterfalls, and browser profiling. A slow Largest Contentful Paint might come from server response, render-blocking CSS, an oversized hero, or late client rendering. Poor Interaction to Next Paint can come from long JavaScript tasks or an expensive event handler.
- Form a hypothesis from the field segment.
- Reproduce the conditions as closely as practical.
- Change one meaningful bottleneck.
- Verify in lab testing before release.
- Confirm the field distribution improves afterward.
Connect performance to user outcomes carefully
Overlay performance with page completion, form success, checkout progress, or support complaints, but avoid claiming causation from a simple correlation. Slow experiences often cluster with devices, networks, and audiences that differ in other ways. Use experiments or controlled rollouts when a business decision depends on the causal effect.
Set budgets and alerts around significant, sustained regressions rather than every fluctuation. Ensure someone owns the alert and has a path to diagnose it. A dashboard nobody reviews does not end an argument; it merely stores it.
Build performance into release ownership
Every important template should have a technical owner and a lightweight budget for images, scripts, fonts, and third-party tags. A release that exceeds the budget needs an explicit tradeoff, not an unexplained exception. Marketing, analytics, and engineering should review third-party changes together because a small tag added outside the main codebase can create long tasks or block rendering for real visitors.
When an alert fires, compare the affected population and release timeline before rolling back. Check whether the change is widespread, limited to one browser, or caused by a vendor response. Preserve a known-good dashboard view and a short diagnostic runbook. The aim is not perfect scores for every visit. It is fast recognition of material regressions and a team that knows which experiment, dependency, or asset to investigate first.
Performance work should include accessibility and functional correctness. A page can post good timing metrics while a keyboard interaction fails, a consent layer blocks content, or a form submission silently errors. Pair RUM with error tracking and a small suite of journey tests. When a performance change removes or delays code, verify that essential behavior still works across representative browsers. The desired outcome is not merely faster rendering; it is a usable task completed with less waiting. That standard keeps optimization from trading a visible metric for a harder-to-detect customer failure. Record that broader verification beside the performance change so later regressions can be compared against a known working journey.
RUM gives the team a shared map of real experience. Use it to choose the next investigation, then rely on engineering analysis to find and verify the fix.
Photo by Atlantic Ambience on Pexels.

Written by
Adrian Saycon
A developer with a passion for emerging technologies, Adrian Saycon focuses on transforming the latest tech trends into great, functional products.